Barcelona’s Financial Recovery: A Balanced Projection
The club has already restructured its sporting operation. Modelling revenue, squad expenditure and earnings together shows how it could remain competitive while making its debt more affordable.


For more than six years, public commentary surrounding FC Barcelona has recycled the same catastrophic vocabulary: crushing gross debt, registration impasses, desperate “levers,” and the mortgaging of future income. Every summer, digital discourse predicts imminent insolvency; every autumn, balance-sheet disclosures are mined for shock-value headlines. These topics are legitimate matters of scrutiny.
Yet most analysis and discourse does not give adequate coverage to how has the club’s underlying capacity to service its debt actually evolved?
What if instead of judging a half-built stadium against a single 12-month operating statement,we could analyse with ore holistic projections projections based on historicals?
What if we did the following?
- Using standard financial roll-forwards, we tested top-line revenue growth across conservative, base, and expansionary paths (3%, 4%, and 5%).
- Explicitly allowed sporting payrolls and operational expenses to expand alongside that income—accommodating market-rate contract renewals for young superstars rather than assuming artificial austerity in perpetuity.
- Measured the resulting EBITDA against hard cash interest and principal amortization milestones?
What if we analysed if FC Barcelona can achieve durable financial stability without stripping its playing squad or surrendering its member-owned identity?
We would attempt this across
- Audited Achievements: Balance-sheet corrections and structural cost cuts that are already signed off in the official accounts.
- Execution Targets: Future operational opportunities—such as the €250m incremental yield from a completed Spotify Camp Nou—that depend on commercial delivery.
- Hard Obligations: Near-term maturities and debt service that genuinely require disciplined treasury management.
Is the debt over its lifespan affordable or beyond control? Let’s find out with some modeling.
The crisis began with commitments that income could no longer support
The roots of Barcelona’s financial crisis did not lie in ordinary overspending, but in the gap between long-term contractual commitments and an unprecedented, sudden collapse in revenues. Sure they also spent recklessly on a few players who could not deliver silverware, but the impact of the contractual commitments was far more lethal.
During the late 2010s, the club constructed an operating model that assumed uninterrupted, double-digit commercial and matchday growth. The board committed unprecedented sums to guaranteed, back-loaded player wages and massive transfer fee amortisations on multi-year agreements. When the COVID-19 pandemic struck in early 2020, it abruptly closed the turnstiles at Camp Nou, dismantled global matchday and museum tourism, and depressed broadcasting and commercial income across Europe.
The audited financial accounts show the speed and scale of the impact: operating revenue plunged from €836.7m in 2018/19 down to €575.4m in 2020/21—a devastating peak-to-trough contraction of 31.2%.
Season   Revenue  Change from 2018/19
-------  -------  -------------------
2018/19  €836.7m             Baseline
2019/20  €708.3m               −15.4%
2020/21  €575.4m               −31.2%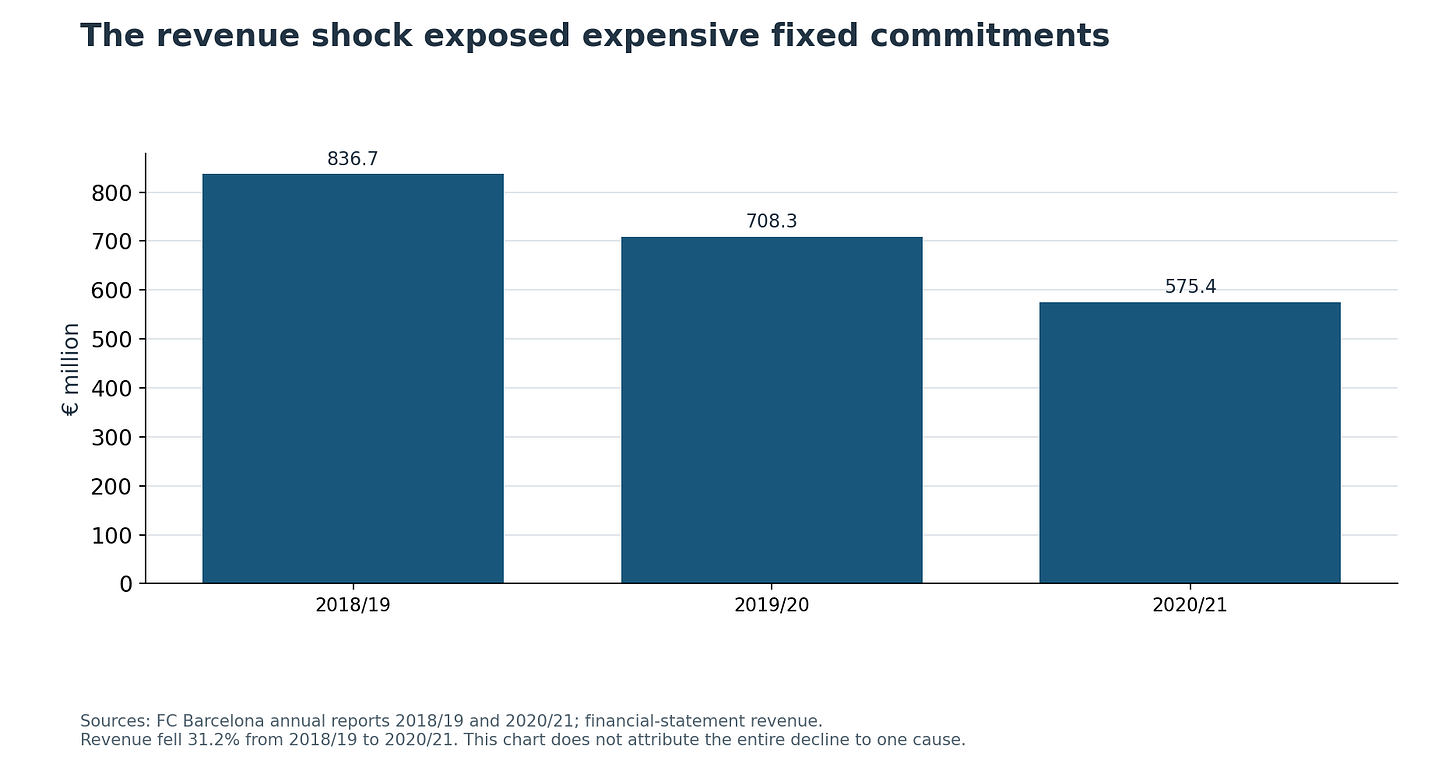
Source: 2018/19 and 2020/21 financial statements, including the latter’s restated comparative.
Elite football operates under severe structural constraints. Player contracts remain legally payable in full even when a stadium is locked shut. Transfer fees must continue to amortise across the length of a contract year after year, even if a recruit underperforms or sits on the bench.
Barcelona did not simply run up a headline debt number; they were trapped in an operationally inflexible cost structure with zero elasticity.
The subsequent emergency liquidity maneuvers—including short-term borrowings and the 2022 sale of 25% of domestic television rights to Sixth Street—were direct responses to this sudden gap, providing the immediate cash needed to survive the shock without forcing a private takeover of the member-owned institution.
The hardest financial adjustments have already taken place
A central pillar of the critical narrative is that Barcelona has merely deferred its day of reckoning, relying on accounting maneuvers while refusing to confront its underlying expenditure.
The truth however, is that the club has already absorbed some of the most severe operational cost adjustments in modern football.
In the 2022/23 season, total sporting costs reached a high-water mark of €676m. That figure reflected not just baseline payroll, but the concentrated friction of dismantling an unsustainable squad: early contract terminations, severance outlays, and the initial amortisation of replacements brought in to restore competitive viability. By 2023/24, that burden had fallen to €505m—an immediate, single-year reduction of €171m, or 25.3%.
Even as on-pitch success, contract escalations, and performance-related incentives carried the 2024/25 figure to €534m, the club’s sporting cost base remained €142m (21.0%) below the 2022/23 baseline.
Season   Sporting costs  Total personnel         Sporting-cost change
                         expense                 from 2022/23
-------  --------------  ----------------------  ----------------------
2022/23           €676m                 €625.7m                Baseline
2023/24           €505m                 €473.8m                  −25.3%
2024/25           €534m                 €510.0m                  −21.0%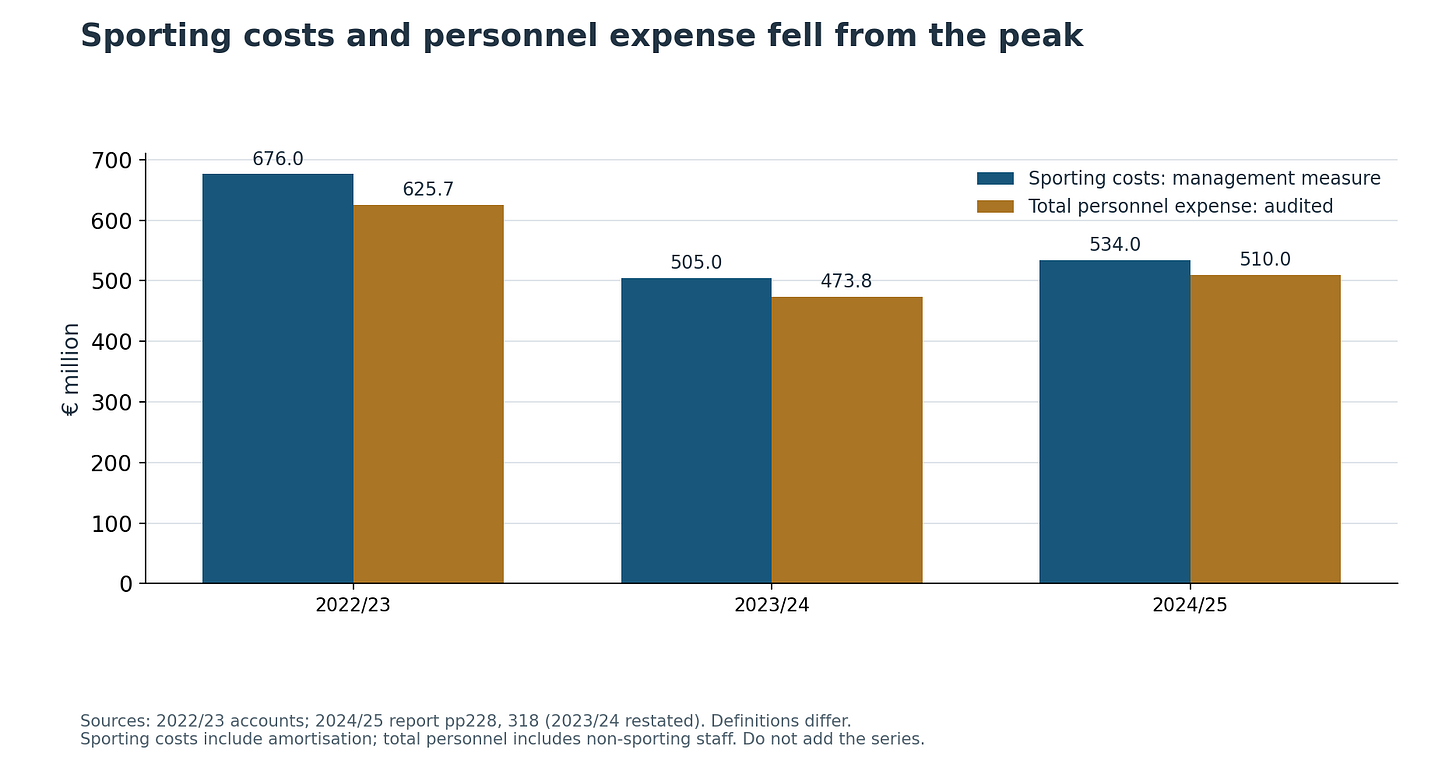
Sources: 2022/23 accounts and management analysis and 2024/25 report, pp228 and 318, including the restated 2023/24 personnel comparative.
(Accounting Note: Audited sporting costs include player transfer amortisation alongside squad wages, whereas total personnel expense encompasses all sporting and non-sporting institutional staff. Because these line items overlap, they reflect parallel measures of contraction rather than additive figures.)
This retrenchment carried immense sporting and institutional friction. It forced the departure of generational anchors like Lionel Messi and necessitated painful multi-year deferral settlements with senior players.
Crucially, while postponing payments via deferrals offered temporary liquidity relief, the structural wage reduction achieved between 2023 and 2025 went much further: it excised permanently unviable commitments from the baseline.
A younger core changed the cost of remaining competitive
The structural reduction in expenditure was not accomplished by simply cutting wages across an aging squad; it was driven by a fundamental transformation in the team’s demographic profile and contractual architecture. Academy graduates became the engine of the sporting project, paired with targeted players recruited in the earliest stages of their senior careers.
In elite football, the greatest recurring drain on cash flow is the constant necessity to replace departing senior stars with established, peak-market acquisitions. Those transactions demand both premium transfer outlays and top-bracket, rigid wage packages. By pivoting to an internally developed core, the club built a sporting model with a structurally lower cost of maintenance.
Player           Age at June 2025  Development route
---------------  ----------------  --------------------
Lamine Yamal                   17               Academy
Pau Cubarsí                    18               Academy
Gavi                           20               Academy
Alejandro Balde                21               Academy
Fermín López                   22               Academy
Pedri                          22  External recruitment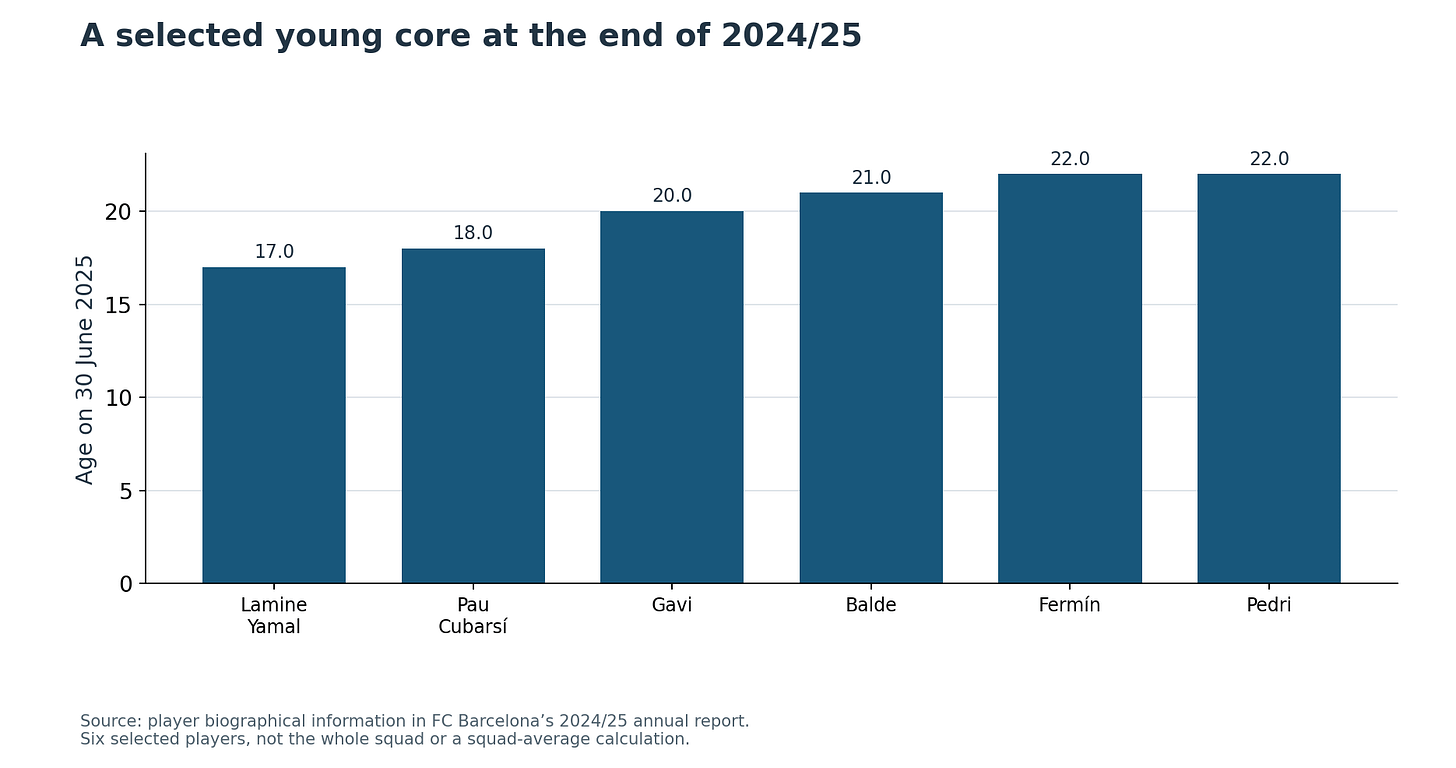
Source: 2024/25 annual report, sporting review and player biographies. The sample is illustrative, not a valuation of the whole team.
Five of these cornerstones emerged directly from the youth academy, carrying an accounting net book value of zero, while Pedri was secured before reaching his commercial peak. While relying on developing talent carries sporting volatility, this core delivered immediate competitive validation by securing the men’s domestic treble and 3 La Ligas in 5 years
This sporting performance directly defended the top-line revenues needed to service the balance sheet: it protected the global brand equity, sustained elite ticketing demand, and drove merchandising turnover (which surged to a record €189.5m via BLM).
From an accounting standpoint, this core provided substantial off-balance-sheet protection. Audited disclosures explicitly state that the fair market value of the squad exceeds its net book value by over €1,000 million.
However, we do need to be mindful that as elite youngsters establish themselves among the world’s best, their wages must rise to reflect market reality.
A sustainable long-term model must explicitly budget for upward wage trajectory over time, rather than assuming academy graduates remain inexpensive indefinitely.
What La Masia provides is an escape from the crushing cycle of transfer-fee amortization—giving the club the financial elasticity to invest in salary extensions rather than €100m replacement fees.
Selective recruitment led to disciplined cash management
In an official club announcement in September 2024, management formally articulated its sporting strategy: anchor the project in the development and retention of home-grown talent, while reserving major external investments strictly for exceptional, high-impact profiles. This philosophy represents the sustainable operational model the club needs—a productive academy pipeline, a protected core of foundational starters, and highly selective market additions.
However, evaluating whether the club has actually adhered to this discipline requires stripping away the ambiguity around the following:
- Announced Transfer Fees: Headline figures published by the media that package base fees alongside contingent performance add-ons.
- Accounting Capitalizations: The amortization value added to intangible assets on the balance sheet and written down over player contract lengths.
- Cash-Flow Movements: The hard cash that actually exits or enters bank accounts within a specific 12-month fiscal period.
A club can announce €100m in headline arrivals while paying only €20m in initial cash instalments during that fiscal year. Conversely, deferred obligations from past seasons can create substantial cash outflows even in windows where few new players arrive.
To verify whether recruitment is truly disciplined, the definitive benchmark is the audited statement of cash flows, which isolates the exact cash payments made and cash receipts collected for sports intangible assets:
Audited cash measure  2023/24  2024/25
--------------------  -------  -------
Payments               €34.3m   €90.2m
Receipts               €79.5m   €11.1m
Net cash investment   −€45.1m   €79.1m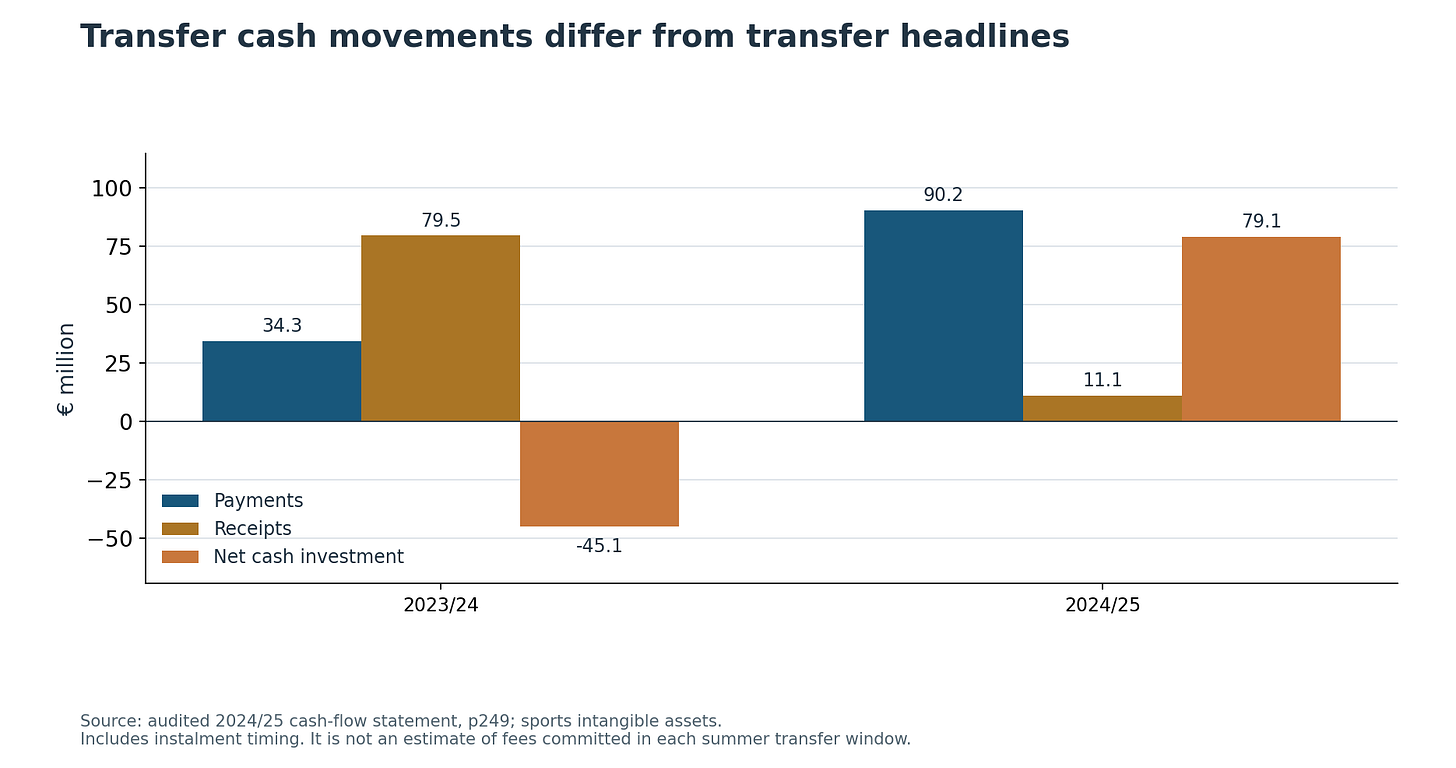
Source: 2024/25 consolidated cash-flow statement, p249. Negative net investment means receipts exceeded payments. The earlier year is the restated comparative.
- The 2023/24 Cash Surplus: Barcelona collected €79.5m from sports intangible disposals while paying €34.3m for acquisitions, producing a net cash inflow of €45.1m.
- The 2024/25 Reinvestment: Acquisition payments increased to €90.2m against receipts of €11.1m, resulting in net cash investment of €79.1m. These payments include instalments and should not be equated directly with fees agreed during that season.
- The Cumulative Two-Year Position: Combined net cash investment was €33.9m, averaging €17.0m per season, calculated using the unrounded audited figures.
Managing cash flow allowed the club to absorb marquee additions without jeopardizing short-term operating liquidity. The audited records verify that in three of the past five years, Barcelona maintained tight cash control, using outgoing transfer collections to offset new recruitment outlays.
Affordability is baked in the wage to revenue ratio, not in a permanently frozen wage bill
Affordability is never measured by a static nominal cost; it is evaluated as a proportional ratio of expenditure against incoming revenue. A rising payroll is entirely viable if the underlying revenue engine outpaces it.
The club’s 2024/25 annual report documents this dynamic directly, recording sporting costs at 54% of ordinary operating income, an improvement from the 56% recorded twelve months earlier.
To interpret these figures accurately, they must be understood within their specific accounting contexts:
- Management Metrics vs. Statutory Accounts: Internal sporting cost ratios are formulated on ordinary operating income, distinguishing them from consolidated total personnel expense ratios, which encompass administrative and non-sporting personnel across all institutional divisions.
- LaLiga Economic Controls: Domestic regulations enforce club-specific squad spending limits (Límite de Coste de Plantilla Deportiva) designed to prevent operational deficits. Following a series of upward revisions as operations stabilized, LaLiga’s official statements confirmed Barcelona’s squad expenditures had been brought under control, operating in harmony with European benchmarks and sitting comfortably beneath the 70% threshold.
- UEFA Squad Cost Rule: Under modern financial sustainability regulations, UEFA tests defined squad costs—aggregating player and coach wages, transfer amortisations, and intermediary fees—against adjusted operating revenues, enforcing a hard regulatory ceiling of 70%.
Measure                            Earlier observation     Later observation
---------------------------------  ----------------------  -------------------------
Sporting costs / ordinary income           56% in 2023/24             54% in 2024/25
La Liga published limit            −€144.4m in March 2022  €582.8m in September 2026
Our projected squad-cost envelope    60% of model revenue   60% each subsequent year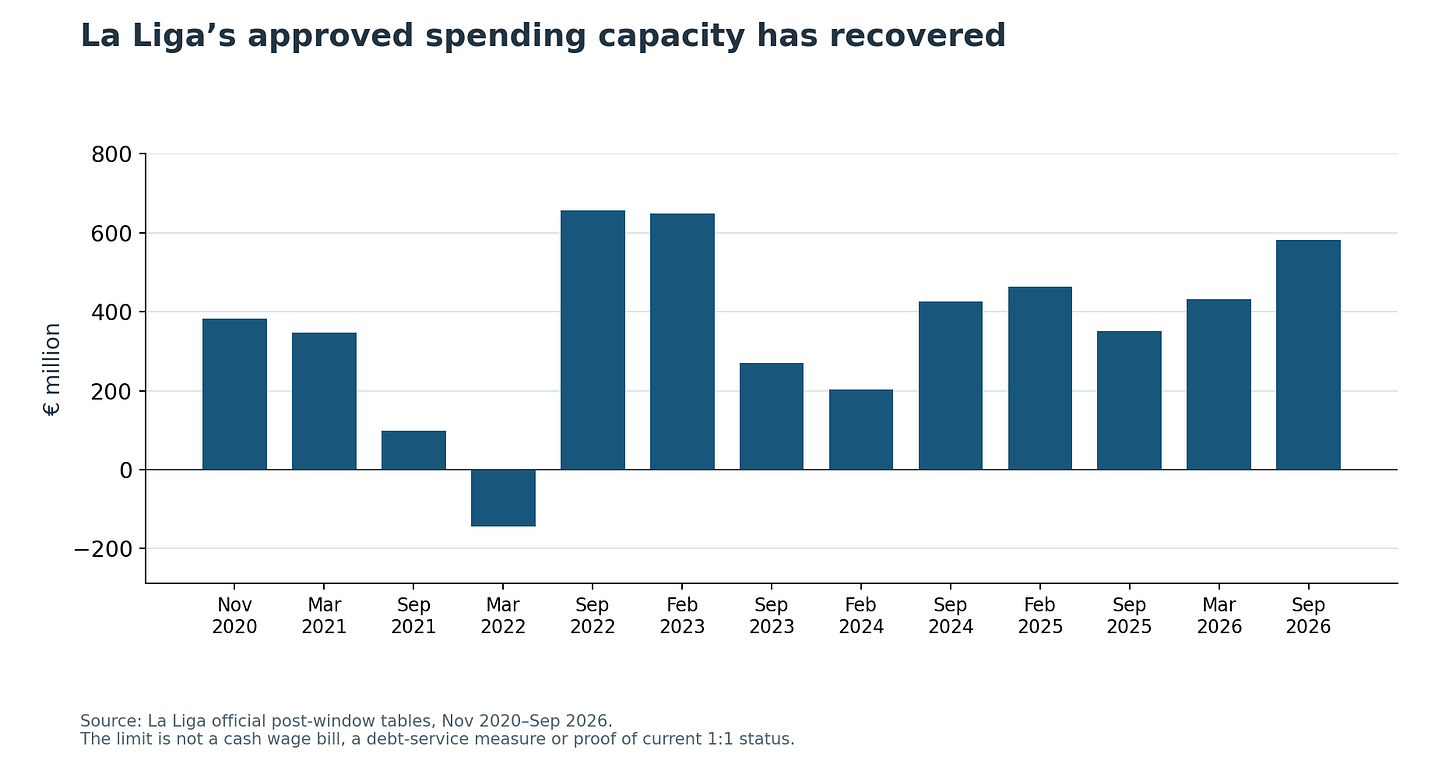
Sources: annual report, p228; La Liga’s 2022 and September 2026 tables; UEFA rule.
True financial recovery does not demand that Barcelona keep player wages artificially depressed forever; it requires that squad expenditure scales proportionally with revenue growth.
By keeping its cost-to-income ratio in the mid-50% range—well beneath UEFA's 70% boundary—the club preserves the capacity to reward and retain its emerging talent while maintaining the cash flow necessary to service its wider balance sheet
To understand future growth we must first understand Barca’s past growth
Any forward-looking financial projection is only as reliable as its historical foundation. Across the ten audited annual reporting periods spanning from the 2015/16 campaign through to 2024/25, the club’s financial-statement revenue expanded from €556.8m to €964.2m. This represents an absolute cumulative expansion of 73.2%, which translates to a compound annual growth rate (CAGR) of approximately 6.29% across the nine compounding intervals between those two fiscal endpoints.
If a business has grown its top line at over 6.2% per year through a decade marked by a global pandemic and a stadium displacement, assuming future baseline growth rates of 3%, 4%, or 5% is not wishful thinking—it is a conservative, disciplined posture that sits well below what Barcelona has proven it can deliver over the long run.
Season ending June  Financial-statement
                    revenue
------------------  ----------------------
2016                               €556.8m
2017                               €579.5m
2018                               €686.5m
2019                               €836.7m
2020                               €708.3m
2021                               €575.4m
2022                               €628.0m
2023                               €795.9m
2024                               €748.3m
2025                               €964.2m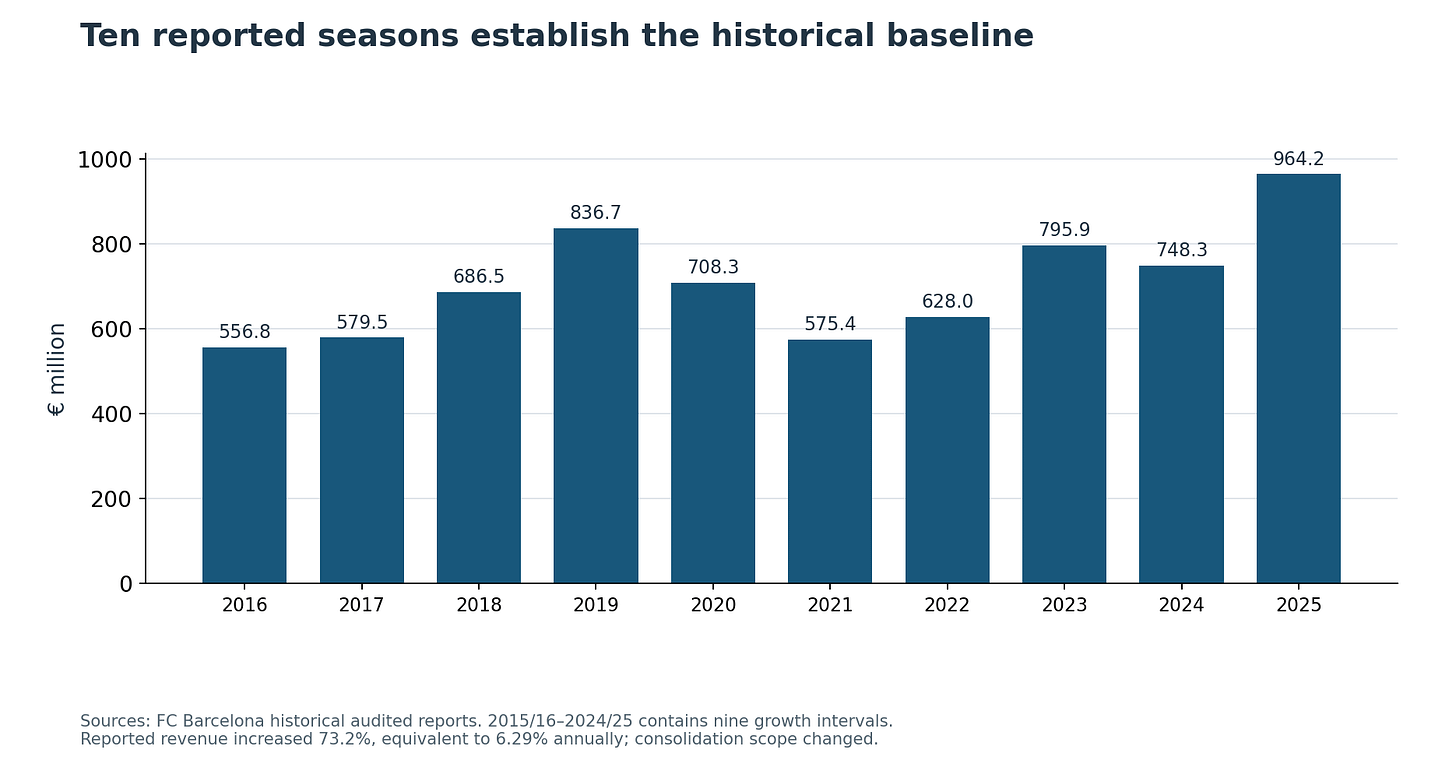
Sources: 2016/17, 2018/19, 2020/21, 2022/23 and 2024/25 reports.
Documenting this 6.29% historical compound growth rate provides an essential sanity check for long-term modeling. It establishes a grounded benchmark that allows us to test lower, single-digit growth scenarios (3% to 5%). It is not a guarantee that future turnover will expand without interruptions, nor does it assume that the macroeconomic or broadcasting conditions of the past decade will replicate themselves automatically.
What it confirms is foundational: FC Barcelona possesses a proven, global commercial engine capable of expanding through severe sporting and operational shock
Slower growth can still produce a much larger business
Rather than asserting an unaudited figure for the 2025/26 season, my forward-looking model anchors itself on a normalized starting revenue base of €1.0 billion in 2026 as an explicit analytical assumption.
Yes of course Covid may happen again, but for this projection i have kept the baseline revenue as €1.0 billion
I have then projected three long-term growth scenarios: 3.0%, 4.0%, and 5.0%. Each of these paths represents a deliberate lower growth percentage than the club’s verified ten-year historical compound rate of 6.29%.
For every subsequent year in the horizon, turnover is calculated by compounding that €1.0 billion base
Year  3% growth  4% growth  5% growth
----  ---------  ---------  ---------
2026    €1,000m    €1,000m    €1,000m
2030    €1,126m    €1,170m    €1,216m
2035    €1,305m    €1,423m    €1,551m
2040    €1,513m    €1,732m    €1,980m
2045    €1,754m    €2,107m    €2,527m
2050    €2,033m    €2,563m    €3,225m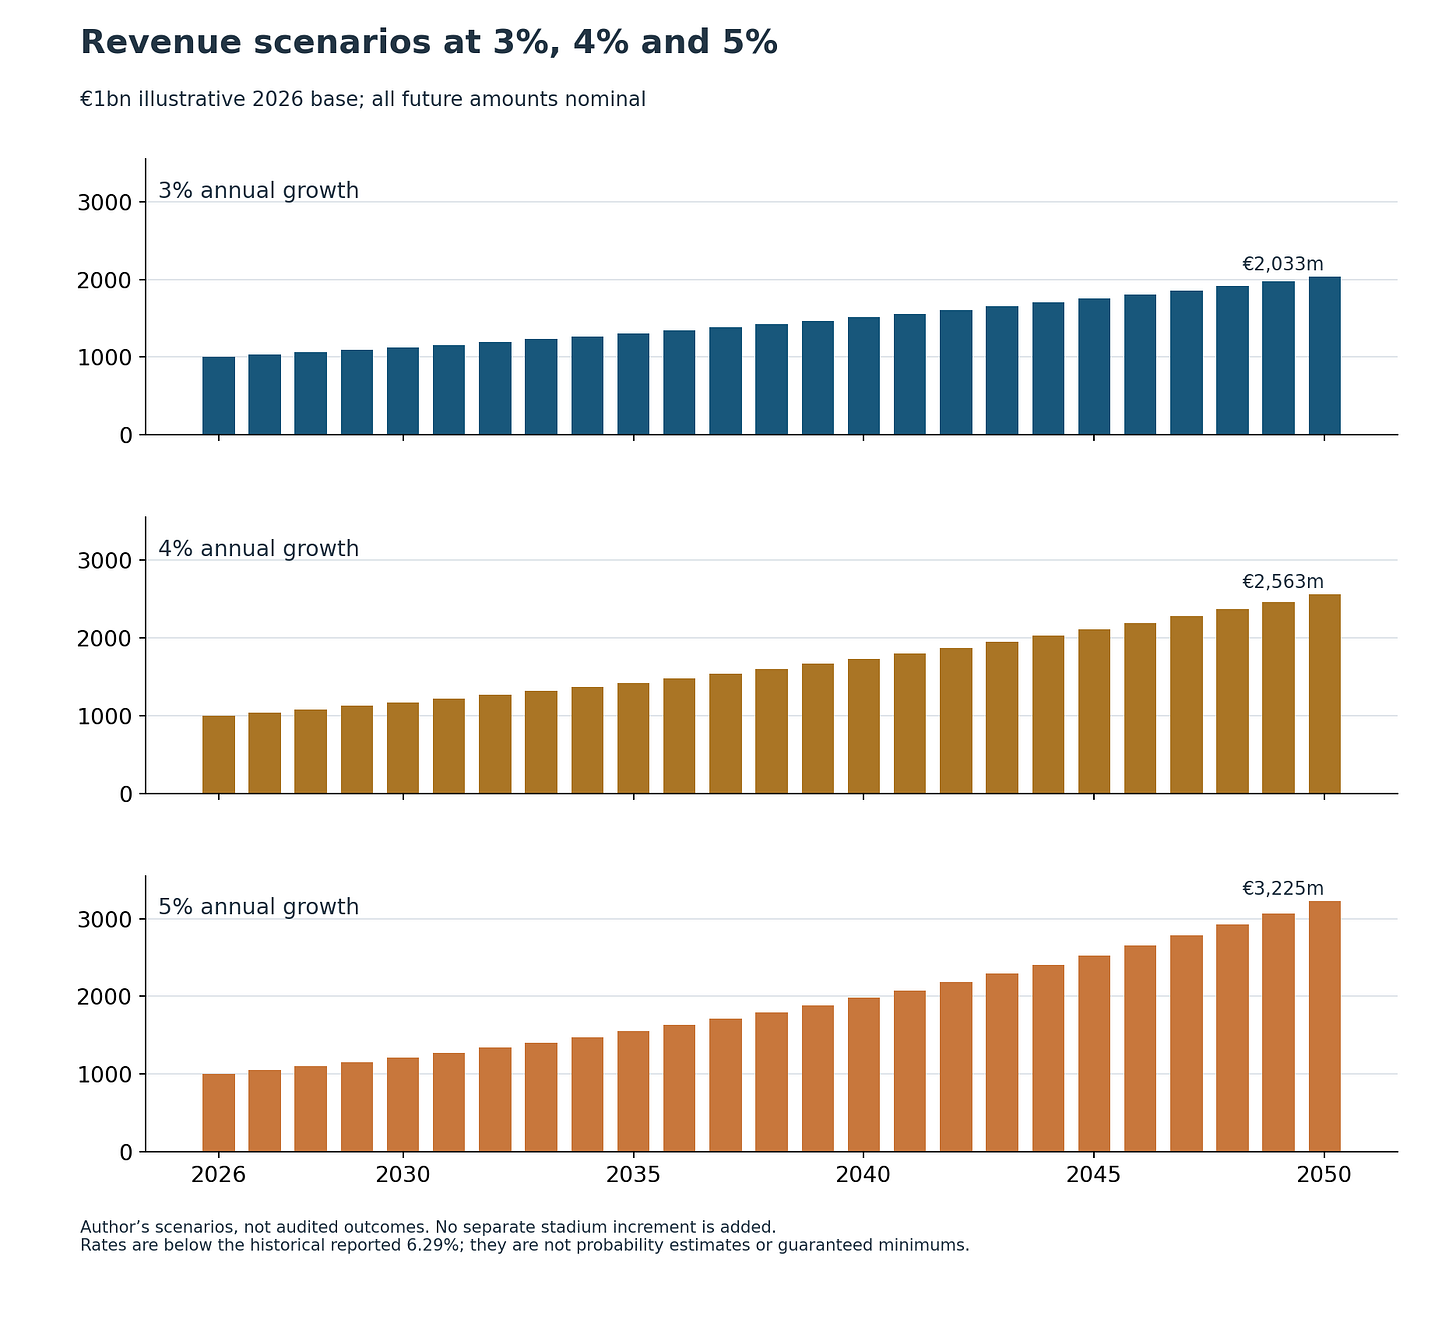
Source: Projection model (Speculative and subject to errors and non attainment))
These modeled trajectories are restrained when measured against historical performance, and they assume no standalone stadium windfall. At the same time, assuming uninterrupted growth across twenty-four consecutive seasons is an analytical simplification, and historical accounting series naturally absorb changes in reporting scope over time. Prolonged sporting slumps, broader economic downturns, or softer domestic and European broadcasting packages could lead to lower realizations.
Even with those caveats, the underlying arithmetic is telling.
At a modest 3% annual growth rate, the club organically expands into a €2.03 billion enterprise by 2050.
Sporting expenditure can grow without abandoning discipline
For a club to be competitive you cannot model a permanent wage freeze, or forecast a dismantling of the squad whenever an elite talent wants a pay raise.
By targeting squad costs at a disciplined ceiling of 60% of total revenue, I took a baseline operational framework where nominal expenditure can expand as needed while protecting debt service capacity.
Under this simplified definition, the total sporting envelope encompasses both sports personnel expenses (first-team and sporting wages) and player amortization. In the audited 2024/25 accounts, player amortization accounted for approximately 8.43% of total turnover. Holding that structural proportion constant leaves an implied 51.57% of revenue dedicated purely to sports personnel salaries.
Non-sporting personnel expenses—such as commercial, administrative, and operations staff—are tracked separately within general operating costs rather than crowded into the sporting ledger. Intermediary and agent fees are absorbed directly within these defined operational categories, ensuring there are no off-the-books or unrestricted spending loopholes.
Year  Squad envelope: 3%  Squad envelope: 4%  Squad envelope: 5%
----  ------------------  ------------------  ------------------
2026               €600m               €600m               €600m
2030               €675m               €702m               €729m
2035               €783m               €854m               €931m
2040               €908m             €1,039m             €1,188m
2045             €1,052m             €1,264m             €1,516m
2050             €1,220m             €1,538m             €1,935m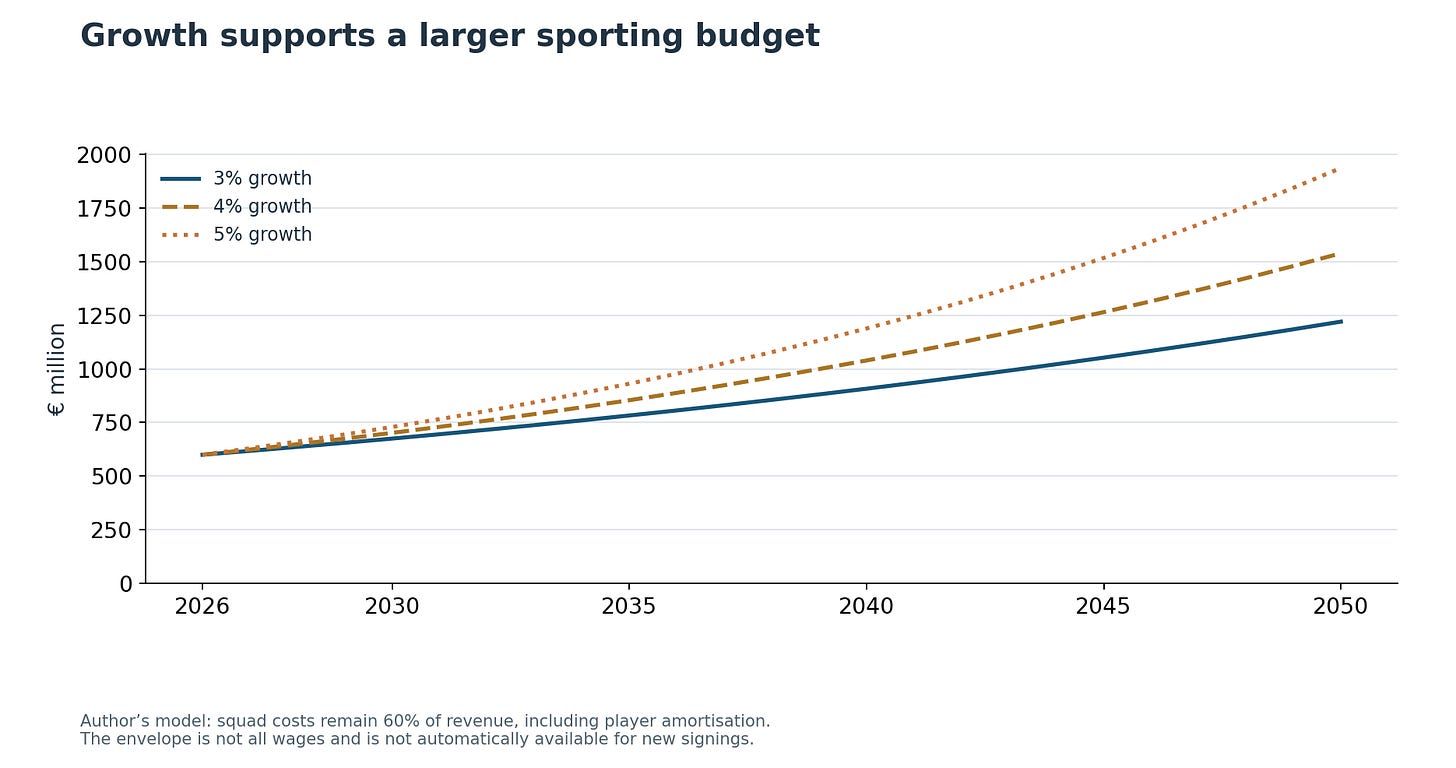
Source: Projection model (Speculative and subject to errors and non attainment))
By 2050, the dedicated sports-personnel salary components alone reach approximately €1,048m (at 3%), €1,322m (at 4%), and €1,663m (at 5%). This means accounting for adjusted pay driven inflation and the occasional marquee signing is quite possible within this framework,
The practical advantage of an expanding 60% boundary is that it accommodates genuine sporting ambition.
Consider a marquee acquisition: a hypothetical €100m signing on a five-year contract generates €20m in annual straight-line amortization. Pair that signing with €20m in annual gross wages, and the total annual accounting commitment lands at roughly €40m before secondary performance incentives.
Within an expanding baseline, this scale of elite recruitment can be absorbed responsibly—provided it represents a targeted addition rather than a return to speculative spending, and assuming phased cash installments are independently funded.
The model absolutely works on the assumption that barring the odd bad year of missed revenue, Barca will continue to grow at a minimum average of 3% YoY till 2050. This is lower than the last 10 years of 6.29% (which had the bad years of covid) But its also true that growing at 6% on €500m is easier than growing at 3% on €1 billion.
So yes things can go wrong, but I have adjusted to a more realistic level where if the club does what it’s doing today - it can retain it’s talent, be competitive and still service its debt comfortably.
The operating surplus must be calculated after the rest of the club
In an elite multi-sport institution like FC Barcelona, the 40% of revenue that sits outside the sporting envelope is not unencumbered surplus. The club operates a massive global enterprise requiring non-sporting personnel, retail supply chain management, IT infrastructure, stadium security, facilities maintenance, and broad administrative operations.
To maintain an objective, conservative baseline, the forward model anchors these non-sporting operating costs to their exact audited proportions from the 2024/25 financial year (Memòria 2024/25, Note 5):
- Non-Sporting Personnel: €75.954m
- Procurement and Supplies (Merchandise/Operations): €79.702m
- Other Operating Expenses: €230.134m
Dividing these three core categories by the verified turnover of €964.203m reveals that non-sporting overhead absorbs 40.01% of total income.
Under standard corporate credit methodology, EBITDA (Earnings Before Interest, Taxes, Depreciation, and Amortization) represents the raw cash-generative power of operations.
Because player amortization is a non-cash accounting charge already built into the 60% sporting envelope, it is added back to arrive at the true operational cash flow.
The formula is: 100% revenue − 60% squad costs − 40.01% other costs + 8.43% amortisation add-back = 8.42% adjusted EBITDA.
Applying this 8.42% cash margin across our revenue compounding horizons yields the underlying operating surplus generated to service debt:
Year  EBITDA: 3%  EBITDA: 4%  EBITDA: 5%
----  ----------  ----------  ----------
2026      €84.2m      €84.2m      €84.2m
2030      €94.8m      €98.5m     €102.3m
2035     €109.9m     €119.8m     €130.6m
2040     €127.3m     €145.8m     €166.7m
2045     €147.6m     €177.4m     €212.7m
2050     €171.1m     €215.8m     €271.5m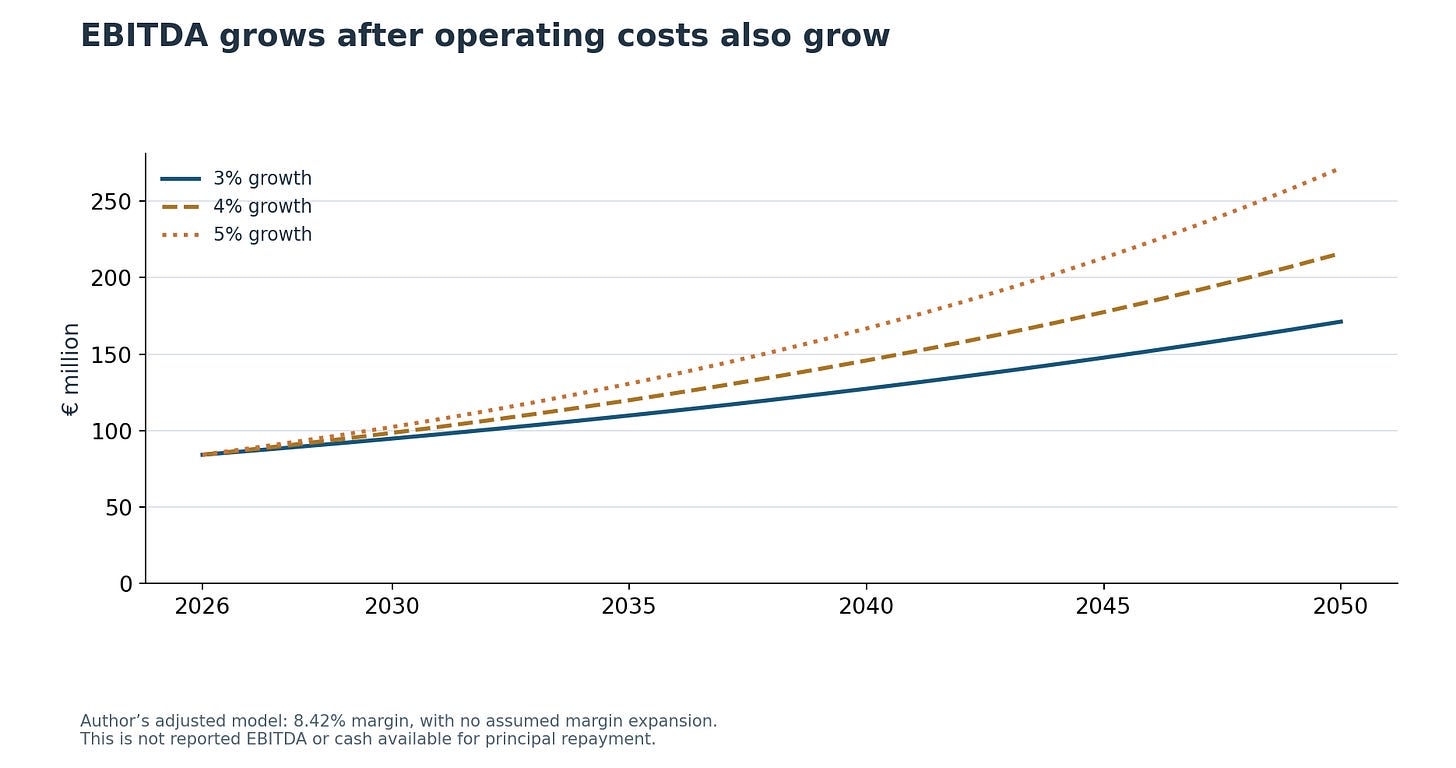
Source: Projection model (Speculative and subject to errors and non attainment))
This adjusted model deliberately excludes one-off asset sales, extraordinary financial income, and non-recurring levers; at the same time, certain retained operating lines contain non-cash provisions. As such, it is an independent cash-flow test rather than a reproduction of the club’s statutory accounting EBITDA.
The structural integrity of this projection rests on one defining principle: every major cost line expands in tandem with revenue.
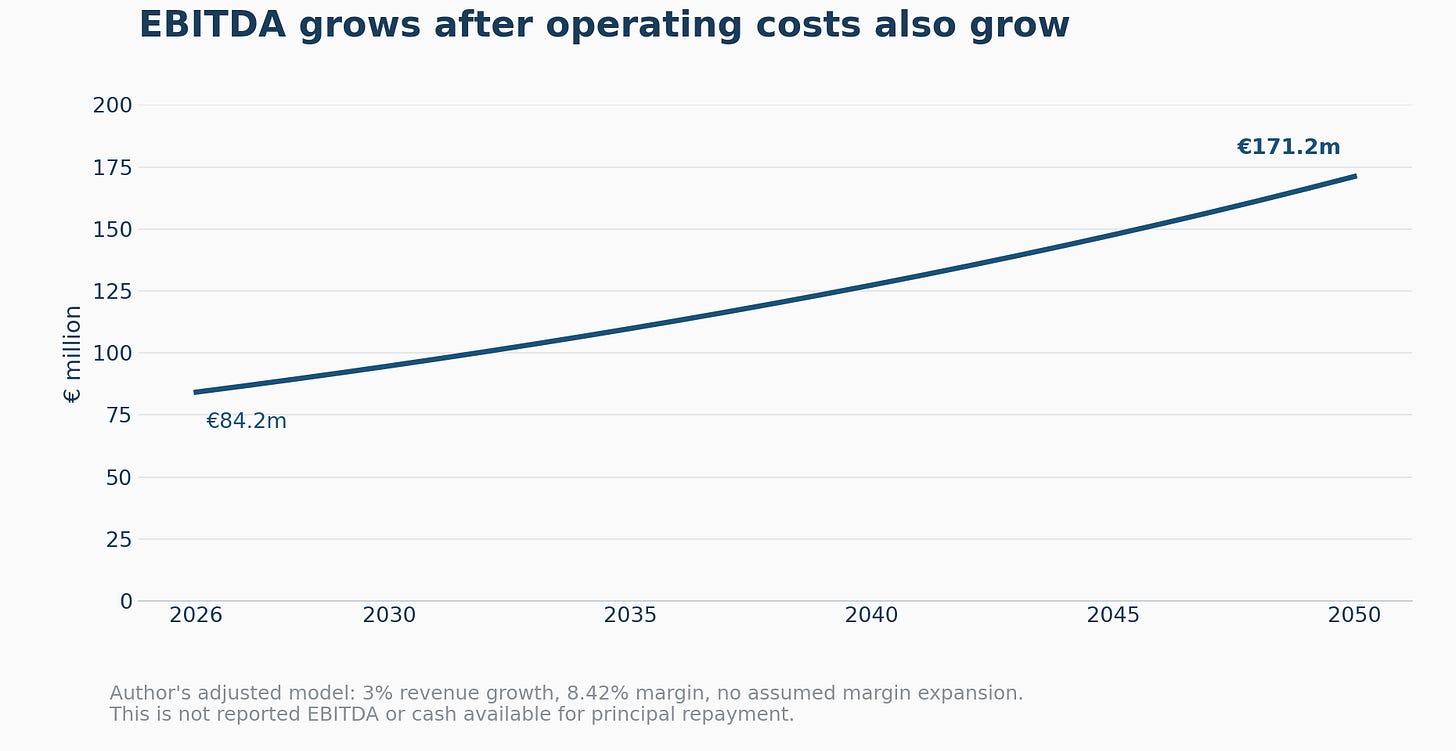
Even in a 3 % growth scenario, annual adjusted EBITDA reaches €171.1m by 2050, even as the annual sporting envelope simultaneously climbs to a massive €1.2 billion.
A larger commercial pie allows a world-record sporting payroll and robust debt-servicing cash flows to comfortably coexist. That balance is the real economic payoff of cost-to-income discipline
Higher earnings make a given interest burden more affordable
Public scrutiny around Barcelona’s capital structure frequently centers on its annual debt service, where cash interest payments approaching €100m are cited as evidence of an unmanageable drain on club coffers.
To isolate the mechanical effect of top-line earnings expansion, the first step is to stress-test this burden by holding annual interest payments constant at an even €100m across the entire projection timeline.
It does not build in optimistic assumptions about refinancing at lower European interest rates, nor does it speculate on additional project borrowing. By testing a flat, unhedged €100m interest bill against an expanding operational base, the model demonstrates how the burden shifts over time
Year  Interest / EBITDA: 3%  Interest / EBITDA: 4%  Interest / EBITDA: 5%
----  ---------------------  ---------------------  ---------------------
2026                 118.8%                 118.8%                 118.8%
2030                 105.5%                 101.5%                  97.7%
2035                  91.0%                  83.5%                  76.6%
2040                  78.5%                  68.6%                  60.0%
2045                  67.7%                  56.4%                  47.0%
2050                  58.4%                  46.3%                  36.8%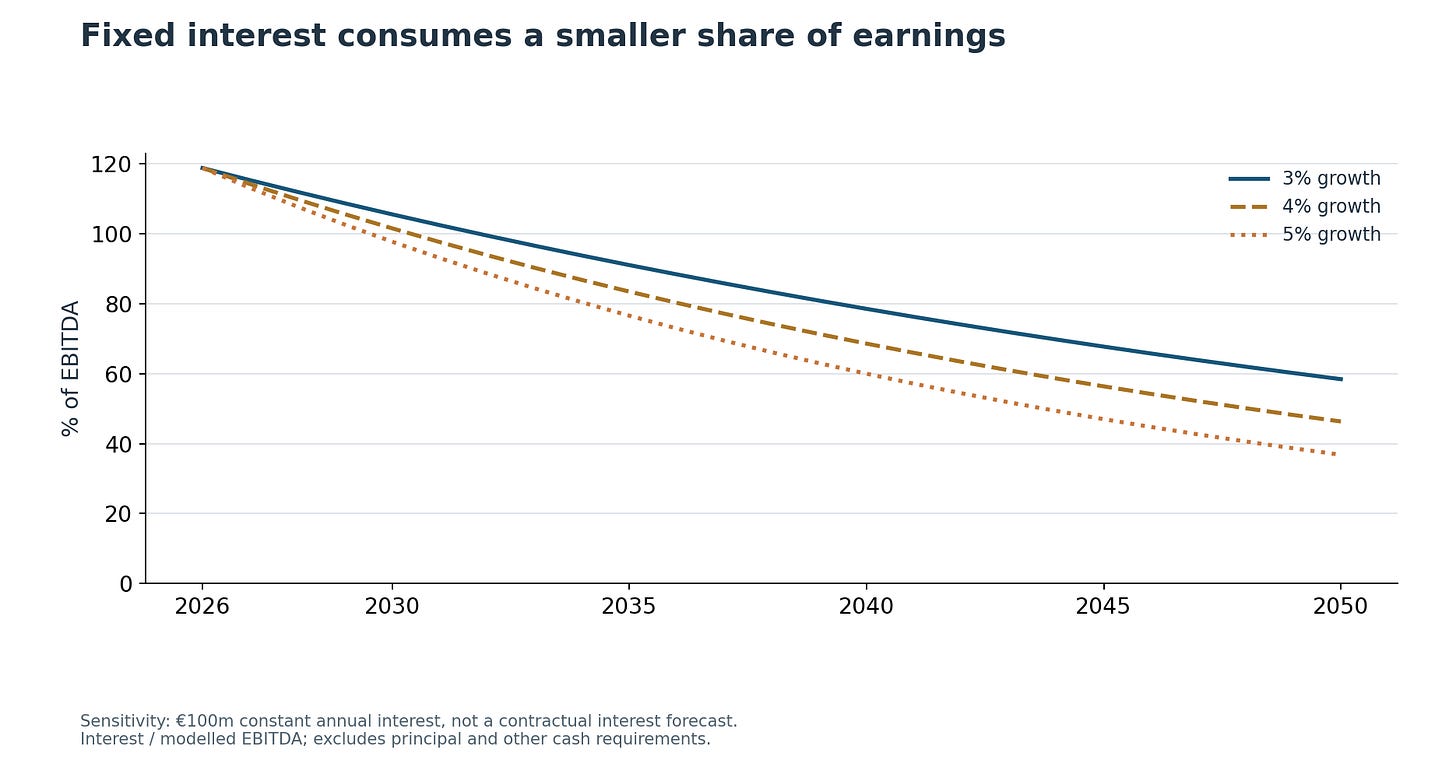
Source: Projection model (Speculative and subject to errors and non attainment))
By 2050, after servicing a full €100m interest payment, the remaining modelled operational cash flow (EBITDA) stands at approximately €71.1m (at 3%), €115.8m (at 4%), and €171.5m (at 5%) prior to principal amortisation, corporate taxes, net player transfer cash flows, maintenance capital expenditure, and working-capital movements.
The initial numbers highlight the genuine liquidity pinch the club is managing today: in 2026, with the stadium partially operational and EBITDA standing at €84.2m, a €100m interest bill consumes 118.8% of operating cash flow. This operational deficit explains why the club has leaned on credit revolvers, trade finance lines, and staggered transfer notes to bridge its working capital.
However, as compound revenue growth takes effect, the debt service ratio starts shiting. By 2035, the same €100m interest bill consumes 91 % of EBITDA in the nominal 3 % scenario. By 2045, it consumes 67%, and by 2050, it drops to just 58.4%.
If the club successfully retires principal, its nominal interest bill will naturally fall; conversely, if construction delays or market volatility force refinancing at wider spreads, debt service costs will rise. Those moving parts belong in a comprehensive debt roll-forward.
A static €100m obligation is a completely different credit proposition for an €84m-EBITDA business mid-construction than for a €171m-EBITDA business that has finished building. And this cushion appears after budgeting a sporting envelope that rises to €1.22 billion.
Loan repayment depends on cash and the maturity timetable
The audited June 2025 accounts (Memòria 2024/25) record €2.573 billion in total gross liabilities. Stripping away accrued short-term interest, deferred income, trade payables, tax obligations and player compensation balances leaves approximately €1.430 billion in core financial borrowing principal on a carrying-value basis.
Combining player transfer instalments, operating supplier bills and season-ticket deferred revenue into a single “debt” figure distorts credit analysis. A supplier payable or a deferred sponsorship credit does not carry the refinancing risk, covenant scrutiny or coupon burden of a syndicated bond.
DISSECTING THE €2.57bn LIABILITY LEDGER (AUDITED JUNE 2025)

Core financial borrowing principal:      ~€1,430m   Carrying value of notes and bank loans
Short-term accruals and deferred income:   ~€251m   Settled via matchday and sponsor delivery
Long-term provisions and accruals:         ~€239m   Non-debt contractual provisions
Operating payables, taxes and transfers:   ~€653m   Trade credit, player notes and tax lines
                                         --------
Total gross liabilities reported:         €2,573m
The real credit risk lies in the maturity schedule rather than the aggregate. Financial debt arrives in heavy, concentrated refinancing windows. Most notably, the senior secured notes backed by audiovisual rights carry a scheduled €265.7m principal bullet in 2031/32.
What the schedule looks like against modelled earnings
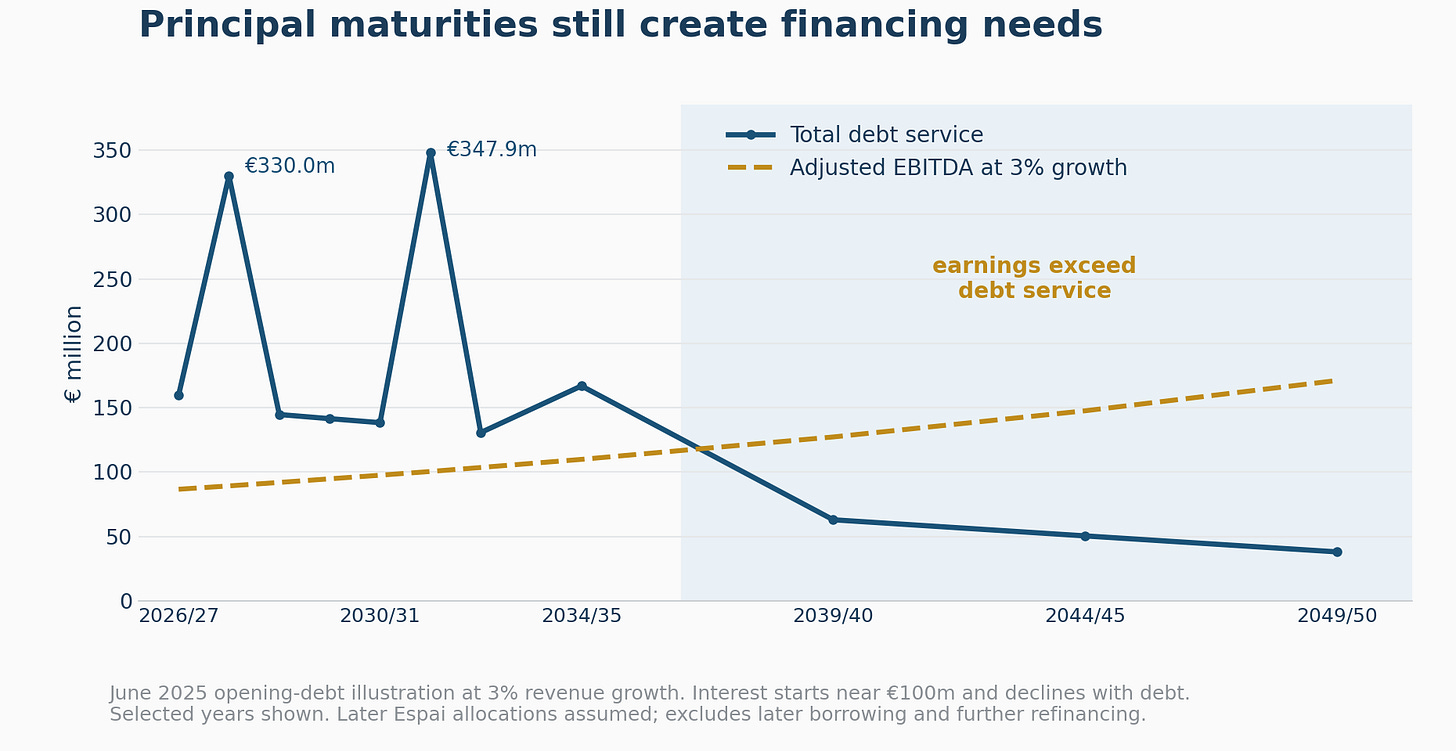
The table below combines the contractually disclosed maturities with explicit amortisation assumptions for the grouped later-dated facilities, and sets them against earnings modelled at 3% revenue growth and an 8.42% adjusted EBITDA margin.
Annual interest starts near €100m and steps down in proportion to the retiring principal.
Before reading it, a note on what this model deliberately leaves out.
Every figure assumes the completed Spotify Camp Nou contributes nothing. No €250m incremental yield, no uplift from hospitality, VIP boxes or naming rights, and an EBITDA margin frozen at 8.42% for twenty-four consecutive years, which means zero operating leverage on a single euro of new stadium income.
That is not what anyone expects to happen. The club’s external consultants model €250m a year once the ground is finished, and matchday and hospitality revenue carries a far higher contribution margin than the club average, because the cost base does not expand when forty thousand more people walk through the turnstiles.
I have excluded all of it on purpose. The argument should not need the stadium to work, and it doesn’t. On 3% growth, with the squad envelope rising to €1.22bn and no stadium windfall whatsoever, a constant €100m interest bill still falls from 118.8% of operating cash flow to 58.4%.
That is the floor, not the forecast. Add the stadium back and every number below improves materially.
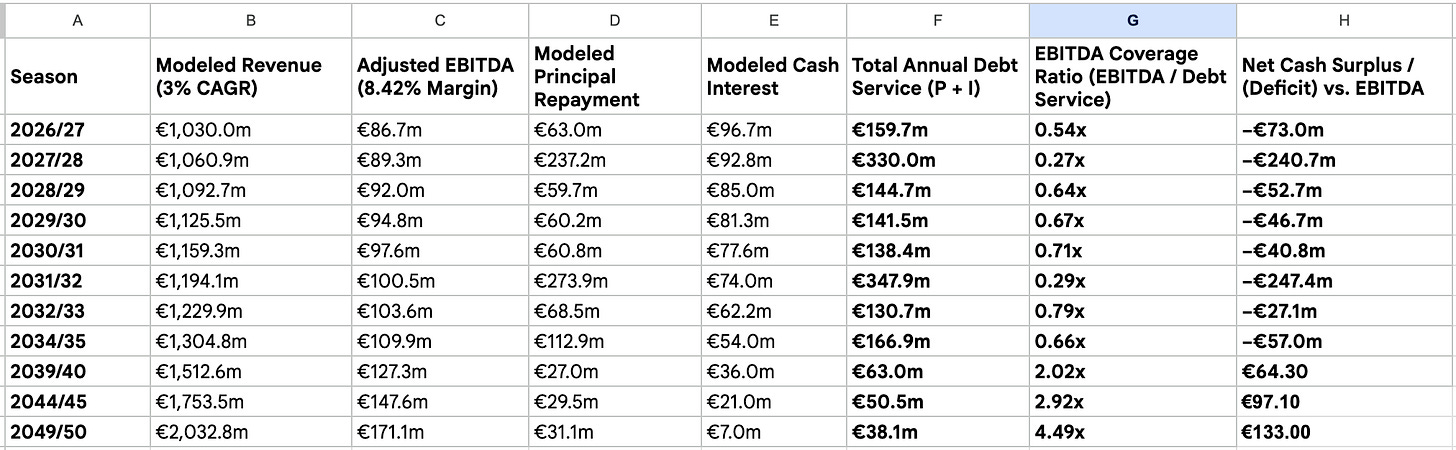
Two things need saying, because the table does not say them by itself.
The early deficits are met by refinancing, not by operating cash. Cover sits below 1.0x until after 2034/35, and across the years shown the cumulative shortfall is roughly €785m. Operations do not fund those repayments in the first decade. Refinancing does. The interest column steps down as principal retires, so the schedule assumes those refinancings are executed on broadly comparable terms.
There is evidence the access exists. The accounts record an executed €424m Espai refinancing signed on 31 July 2025, amortising between 2033 and 2050 at an average cost below the level set when the structure was created. That is a completed transaction on disclosed terms rather than an expectation. Future rounds still have to be negotiated.
Debt service exceeds what the club generates until the middle of the next decade, then inverts decisively. By 2039/40 the same schedule is covered twice over, and by 2049/50 more than four times.
The objective is sustainable debt alongside a competitive team
A successful recovery need not end with every loan repaid. Debt can be useful when it finances assets with adequate returns or preserves necessary liquidity. Its desirability depends on the use of funds, financing terms and the club’s ability to meet commitments.
For scale, consider a residual €100–300m balance at 5% interest against the central 2050 scenario: €2.563bn of revenue and €215.8m of adjusted EBITDA.
Residual debt  Annual interest at 5%  Interest / central
                                      EBITDA
-------------  ---------------------  ----------------------
€100m                          €5.0m                    2.3%
€200m                         €10.0m                    4.6%
€300m                         €15.0m                    7.0%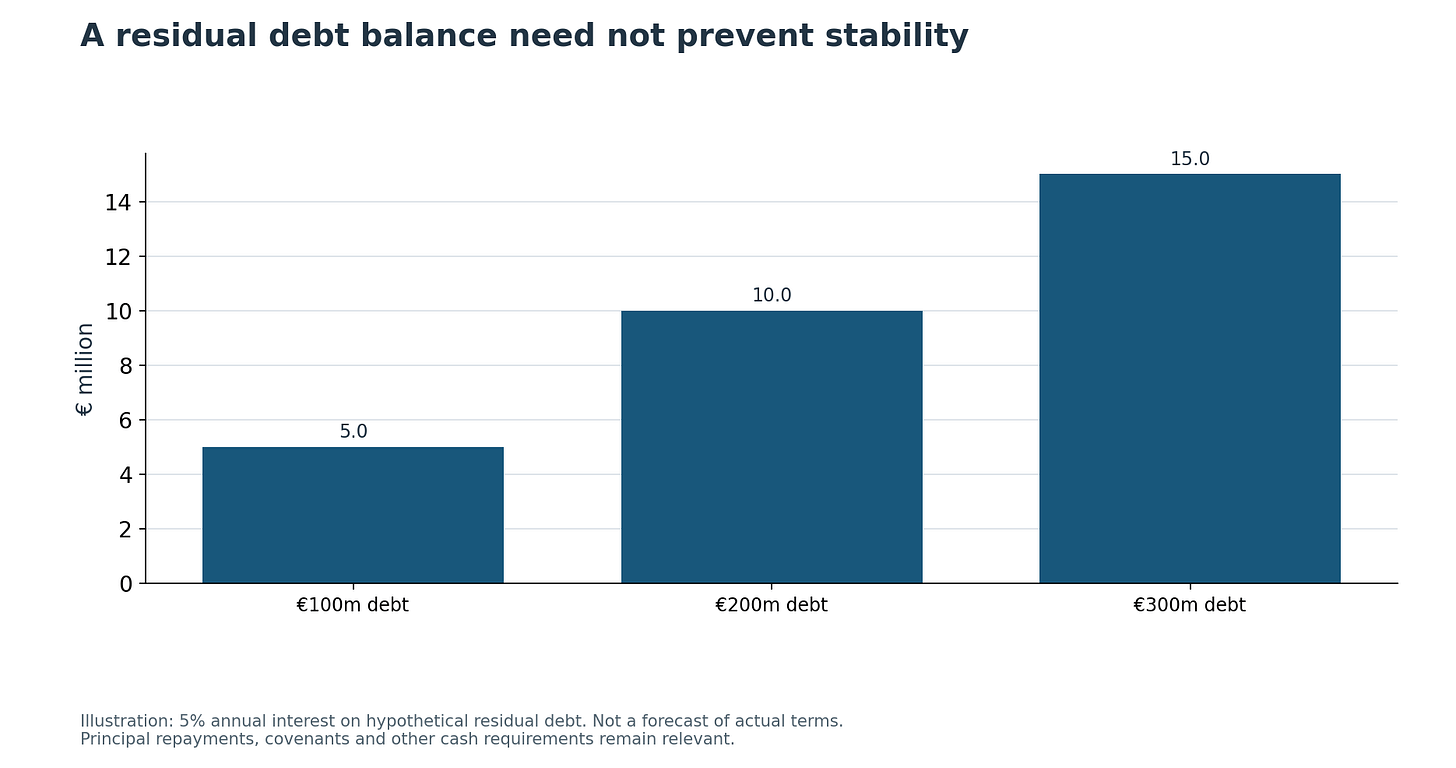
These debt balances and rates are assumptions. Barcelona have reduced sporting costs from the restructuring peak, developed a younger core and adopted a more selective investment policy. The audited revenue record shows substantial growth, while the forward scenarios allow wages and other costs to rise rather than requiring another permanent spending freeze.
At growth rates below the historical reported rate, the model permits a much larger sporting budget and higher earnings.
Those earnings can make interest less burdensome and improve the resources potentially available for principal. Whether that improvement is enough in each year depends on the remaining cash requirements and the financing timetable.
This is a credible route to stability without assuming another wholesale dismantling of the team. It is not a guarantee. The remaining risks are identifiable: construction delivery, cost control, cash conversion and refinancing.
Negative equity of €152.7m at June 2025 also remains a balance-sheet weakness.
Barcelona’s financial position should therefore be assessed as a business that has changed substantially and still has work to complete. The recovery matters because it changes the capacity to carry obligations. The final test is whether the club converts that stronger operating base into dependable cash while preserving the football that supports its income. It has successfully done so till now. The next decade will give a more defensible answer.